Announce a hack weekend and be very responsive on GitHub, some chat (IRC, Matrix, Discord) or a live stream. Plan out some top "would be nice" issues and features that new people could do.
I did this for one of the somewhat less active projects I started maintaining and have gotten several regular contributors as a result.
Kevin Wittek
in reply to daniel:// stenberg:// • • •daniel:// stenberg://
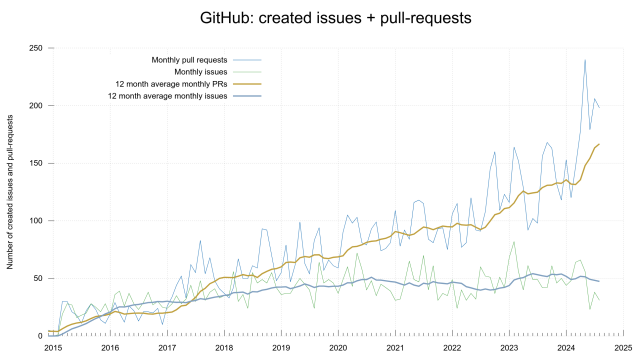
in reply to Kevin Wittek • • •@kiview yes: I pull down all PRs/issues daily using the API and the graph itself is made with gnuplot.
The full dashboard is here: https://curl.se/dashboard.html
The scripts for everything are here: https://github.com/curl/stats
GitHub - curl/stats: Scripts for generating project statistics and for plotting them as graphs.
GitHubKevin Wittek
in reply to daniel:// stenberg:// • • •testcontainers
GitHubPeter Bhat Harkins
in reply to daniel:// stenberg:// • • •daniel:// stenberg://
in reply to Peter Bhat Harkins • • •Morten Linderud
in reply to daniel:// stenberg:// • • •@pushcx
I sorta did this once.
Announce a hack weekend and be very responsive on GitHub, some chat (IRC, Matrix, Discord) or a live stream. Plan out some top "would be nice" issues and features that new people could do.
I did this for one of the somewhat less active projects I started maintaining and have gotten several regular contributors as a result.
Daniel Böhmer
in reply to daniel:// stenberg:// • • •I found the chosen colors hard to distinguish in the key section and map to the graphs.
#curl does actually get way more PRs than issues?!
daniel:// stenberg://
in reply to Daniel Böhmer • • •